Handling multiple relevant date fields in Power BI is a challenge I encounter in almost every project. Whether you’re working with invoices, sales, or project data, it’s common to have more than one meaningful date on a single fact table. For instance, invoice data typically includes both an invoice date and a due date, sales data often has an order date and a shipping date and project data may track a start date and a projected end date.
Since time is a crucial analytical dimension, we almost always want to visualize our KPIs over time or enable users to filter the data using a date-based slicer. For example, in financial dashboards, you might track invoiced amounts by month but you may also want to understand when those amounts are expected to be received based on due dates. Similarly, while sales teams are mostly interested in the date an order is placed, the logistics departments care more about the shipment date.
Following Power BI best practices, we build star schemas with a separate, marked Date table. But Power BI only allows one active relationship between two tables, so how do we handle multiple relevant date fields like invoice date, due date, or shipment date in the same table? There are two different solutions:
- Using inactive relationship + USERELATIONSHIP()
- Handling all logic in a measure (to reduce inactive relationships)
Example Scenario
In our example, we have an invoice table with product, customer, quantity, amount, invoice date, and due date. Using the default (active) relationship to the Date table via invoice date, we can already track invoice amount per month but now we also want to track the due amount.
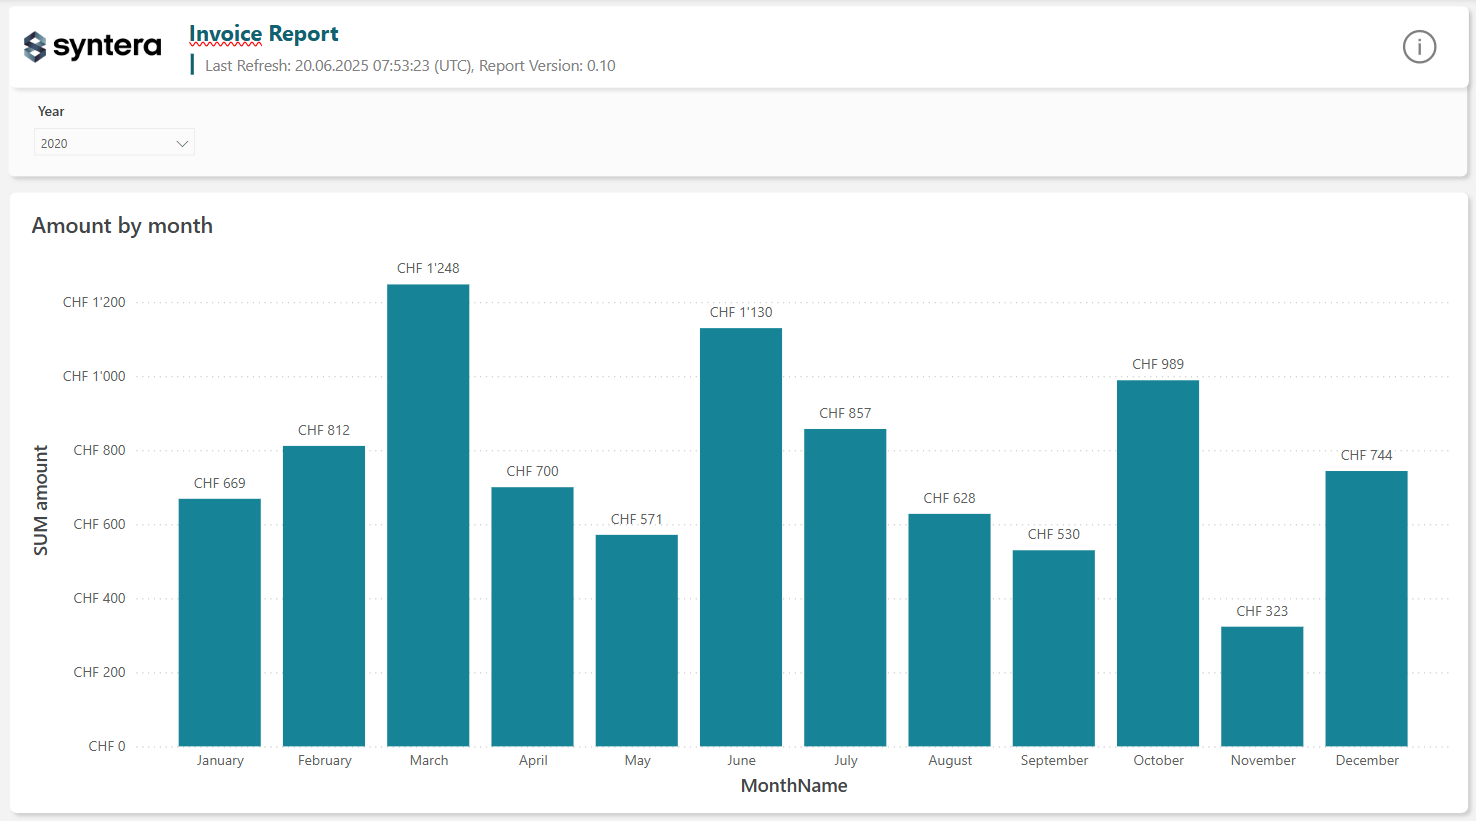
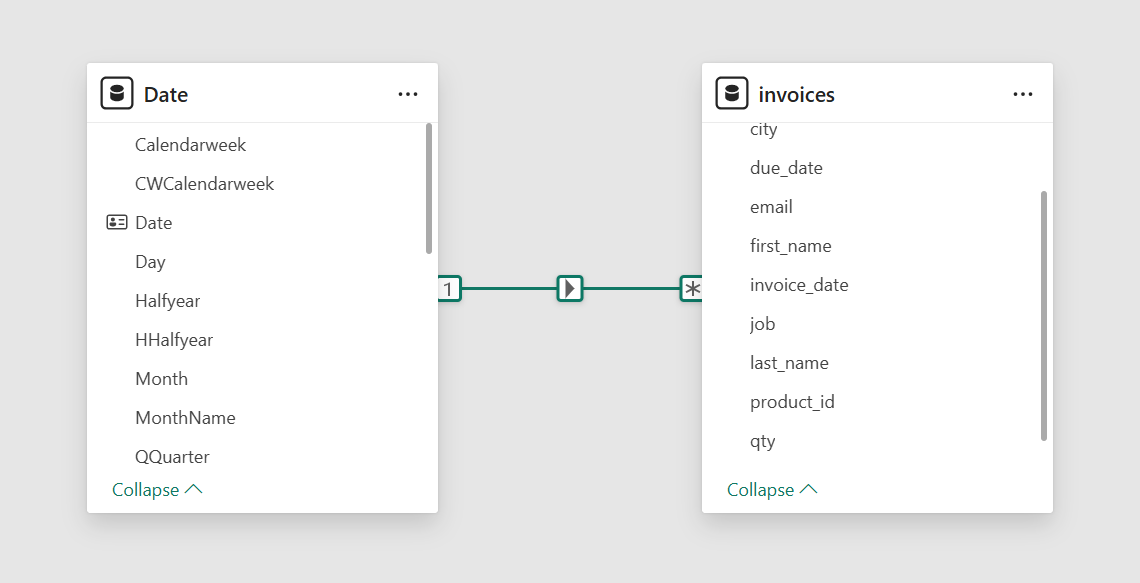
The model currently includes a dedicated Date table linked to the invoice table via invoice_date.
Inactive relationship + USERELATIONSHIP()
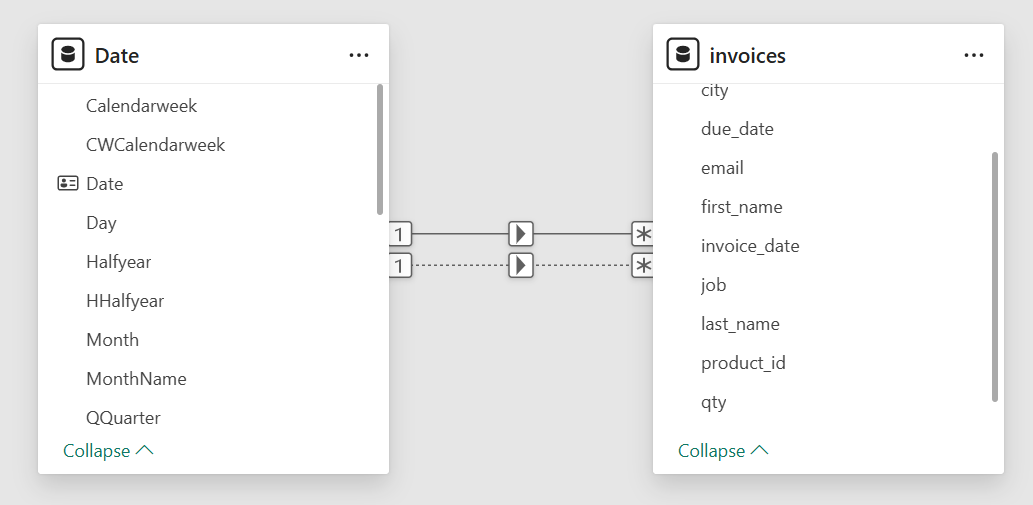
Power BI only allows one active relationship between your Date table and a fact table. But you can create as many inactive relationships as needed. In our example, we add an inactive relationship between the Date table and the due_date column of the invoice table.
By default, the active relationship (invoice_date) is used. To calculate metrics based on other dates, you can explicitly activate those inactive relationships for a specific calculation inside your DAX measures using USERELATIONSHIP():
SUM amount due =
CALCULATE(
    [SUM amount],
    USERELATIONSHIP('Date'[Date], invoices[due_date])
)
This tells Power BI to use the due_date → Date relationship just for this calculation, without altering the default model behavior. That means we can now show both the amount by invoice date as well as the amount by due date in the same visual, and still use our Date table as slicer or dimension.
Without using inactive relationships
Although using inactive relationships is usually the easier and cleaner way, there are cases (especially in large models), where it’s better to avoid them. When you have a fact table with many different date columns, adding a relationship for each one can quickly become unmanageable.
Instead, you can solve this using DAX only, without creating any relationship at all. It’s a bit more work, but it gives you full control and keeps the data model cleaner.
The idea is to:
- Capture the selected date range from the Date table using MIN() and MAX()
- Remove any filters on the Date table
- Apply the filter directly to the due date field in the fact table
SUM amount due no relation =
VAR _MinDate = MIN('Date'[Date])
VAR _MaxDate = MAX('Date'[Date])
RETURN
CALCULATE(
[SUM amount],
REMOVEFILTERS('Date'),
DATESBETWEEN(
invoices[due_date],
_MinDate,
_MaxDate
)
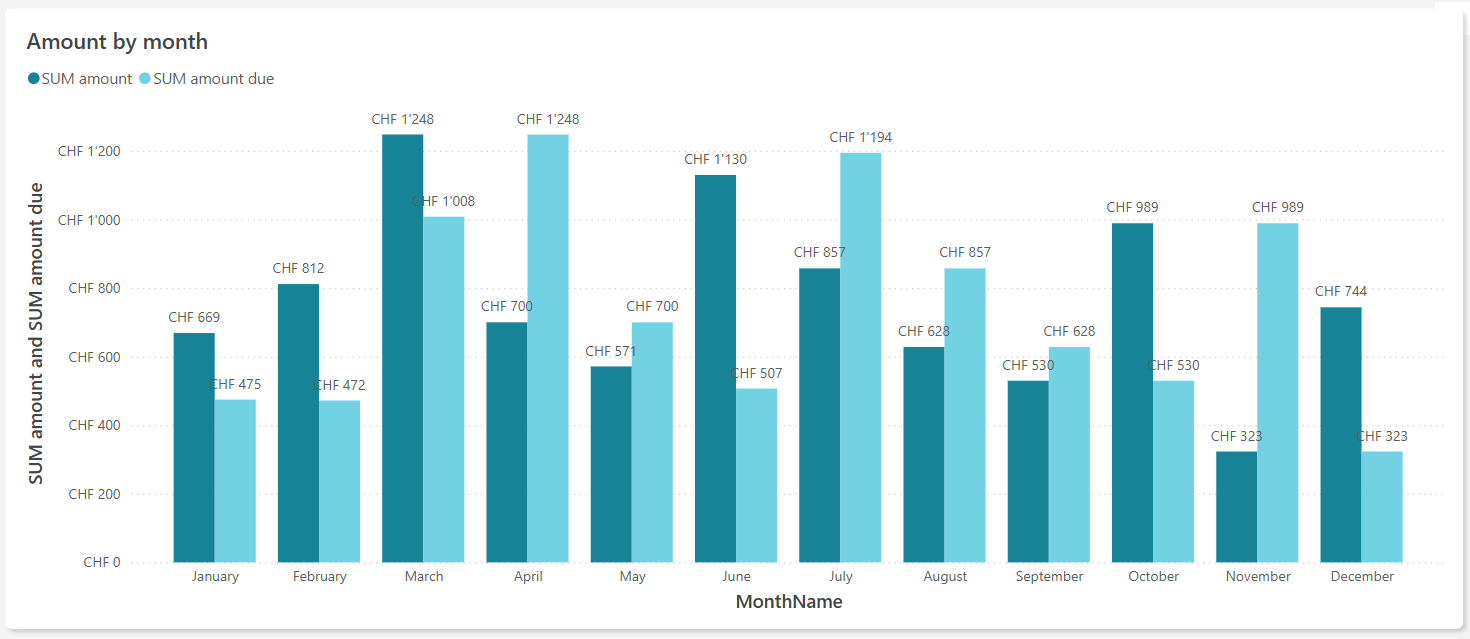
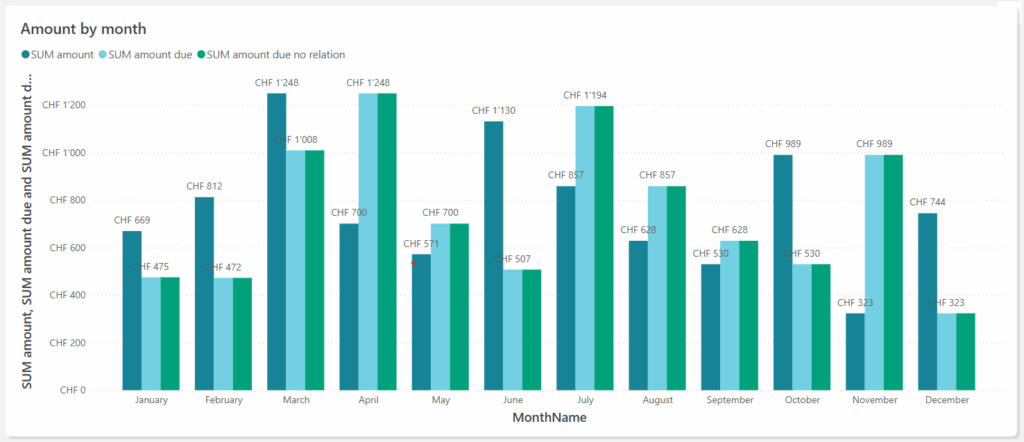
)This measure will respect the selection made on the Date table but instead of relying on a relationship, it applies the filter directly to the due_date column. The result is exactly the same, as can see in the visual below (lightblue: using inactive relationship, green: without using inactive relationship)
Read More about Power BI:
One response to “Handling multiple Dates in Power BI”
How do these options work with Slicers?
Using this example, say I wanted to use a slicer to filter the due dates, how could I implement this?