Working with Power BI can become challenging as the size and complexity of your workspaces increase. Initially, managing a few reports linked to your dataset is straightforward. However, as the number of reports and their dependencies grow, keeping track of everything becomes more difficult.
Power BI offers the option to see, what artefacts in your service are impacted. With the so called “lineage view” you get a list of all your dependent elements. But there is no way to quickly see how the reports are impacted by your changes and if there are any errors. Often we only have small changes to deploy, sifting through all your reports again just to make sure there are no broken visuals gets very tedious.
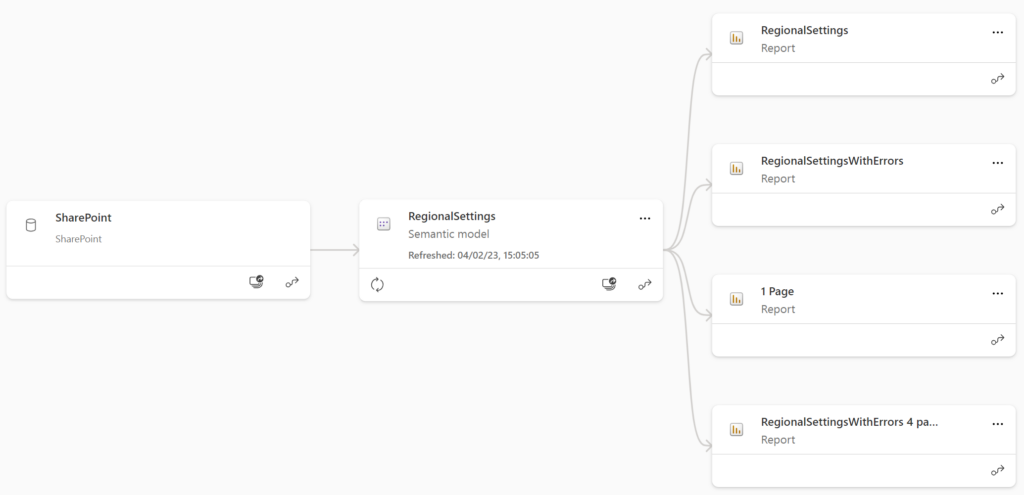
To maintain the quality of our reports while reducing iteration time, we’ve adopted automated testing using Selenium, an open-source tool for web browser automation. Selenium is a popular open-source framework used for automating web browsers. It allows to simulate user interactions with web browsers such as clicking buttons, filling forms, navigating through web pages, and extracting data.
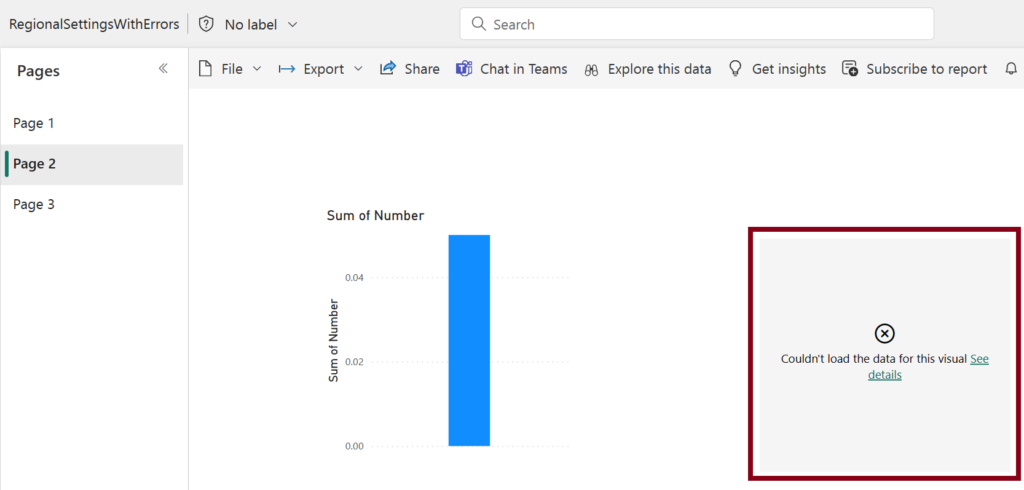
Consider a simple yet critical scenario: after updating the semantic model, a visual on a report page shows an error message. This can happen if you haven’t been paying attention to the Impact of renaming columns in Power BI. The result are visuals looking like this:
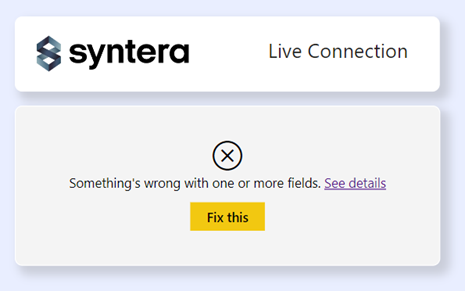
Within the report you are currently working with, it is easy to catch those errors right away. But what if you already have 10 other reports published? How are you sure that your update is not breaking something that worked previously? If you want to ensure there is no issue, you have to check all reports again. But this check doesn’t have to be done manually. That’s where Selenium is coming in to play.
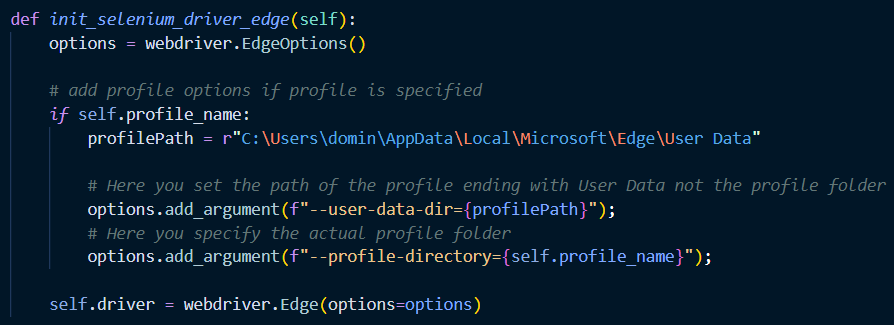
Here are the simple steps of using browser automation within python. If you are already logged in to Power BI, all you need is the URL of the report you want to check. Because we use different browser profiles for different tenants, we initialize Edge with Selenium specifying options for a certain browser profile:
After that we navigate to the URL of our report. Because Power BI can take some time to load the report, we give the process 20 seconds to find the “pbi-overlay-container”. As soon as it is found, the function completes.
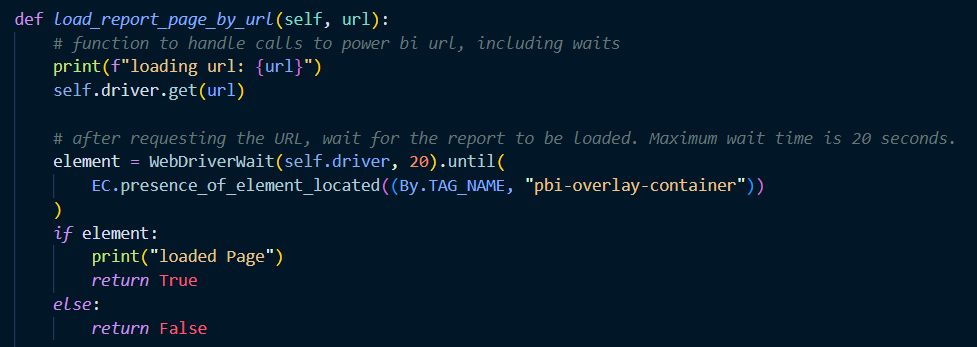
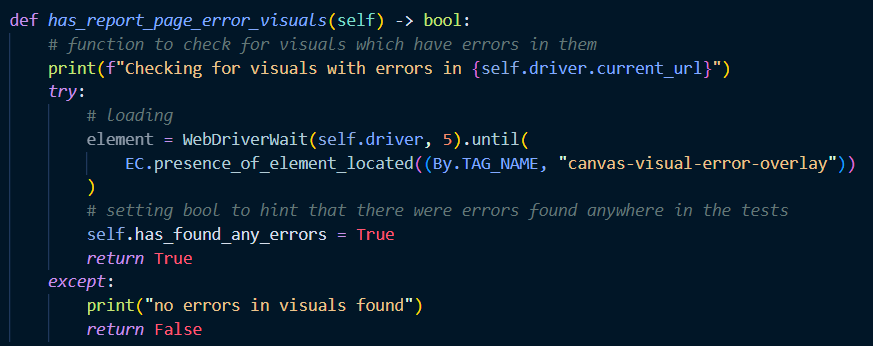
Finally, we repeat the process to check if the element “canvas-visual-error-overlay” is present. Here the wait time is limited to 5 seconds to ensure the visuals have time to load:
This logic can be chained with multiple URLs to allow multiple reports and pages to be checked. The video below shows you how it looks like if you are looping through multiple reports within a single workspace when running Selenium from Visual Studio Code. Note the message at the top of the browser “Microsoft Edge is being controlled by automated test software”:
The result can then be exported to quickly give an overview if there were errors and where. The link to the page allows to quickly check the respective report page yourself.
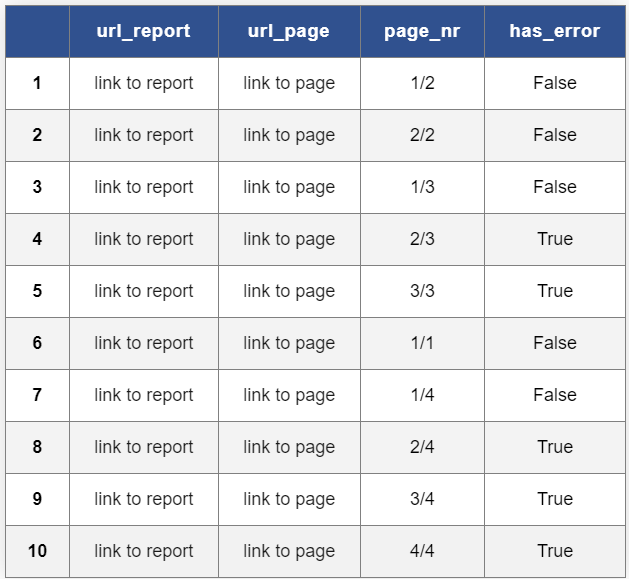
Sure enough after clicking on a link for a report page which has errors, we see that there is indeed something wrong with the visual:
Final Thoughts
Automating tests doesn’t guarantee more efficient working or improved quality by default. But there is a tipping point in the complexity of your environment where it is extremely useful in supporting both efficiency and quality. We recommend to use this mechanisms if:
- You are following the Microsoft guidance to separate semantic model and multiple report files with a live connection pointing to your central dataset.
and either: - have multiple data analysts which are building reports that are not isolated from each other and it can’t be reasonably expected that they test all the reports depending on their work.
or: - if you anticipate frequent minor updates to your environment. It’s natural for manual testing efforts to gradually diminish over time, making it increasingly likely that some changes might not be thoroughly vetted for errors.
In these scenarios automated testing can tremendously improve your ability to deliver high quality reports without slowing your team down.
Other Use Cases
The shown example about checking for errors in visuals is just a small part of what is possible. Here are some more ideas on what can be tested with this setup:
- Verify that reports load correctly, displaying the intended first page upon deployment.
- Ensure the filter panel remains hidden by default across all reports, maintaining a clean and focused user experience.
- Detect any blanks in your reports that could indicate missing or improperly loaded data.
- If you have an info icon, check if it is working when clicking it
The Code
Let us know if you are interested in the code used in this example.
