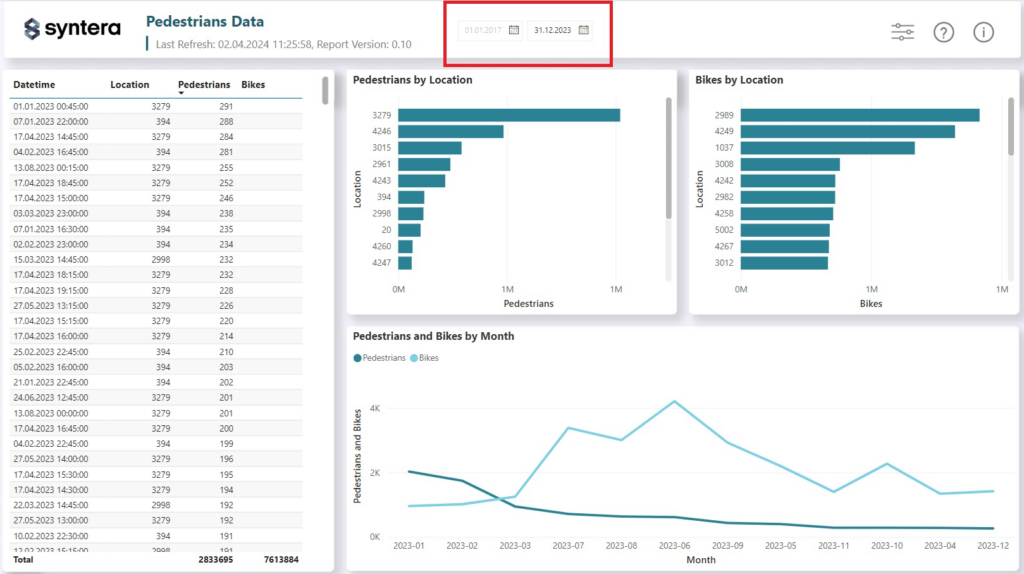
In the sphere of data analysis and visualization, Power BI emerges as a leading tool, adept at turning raw data into comprehensive reports and dashboards. Despite its strengths, we’ve found it lacking a specific, commonly used feature: the integration of a single date picker within a report. This feature, surprisingly not included by default, is vital for crafting reports that are both interactive and user-friendly if you want to analyze data based on specific days. We explored some workarounds, such as those suggested by Guy in a Cube (Video 1 & Video 2). They necessitate either duplicating all existing measures or resorting to calculation groups, which we didn’t find ideal.
Solution
So, how do we incorporate a single date picker without modifying or adding to the dataset? We refine the approach suggested by Guy in a Cube, employing a “top 1” filter across all visuals, complemented by strategic slicer and shape layering. This technique hides elements we prefer to keep out of the end user’s view, achieving our objective with minimal disruption to the existing setup.
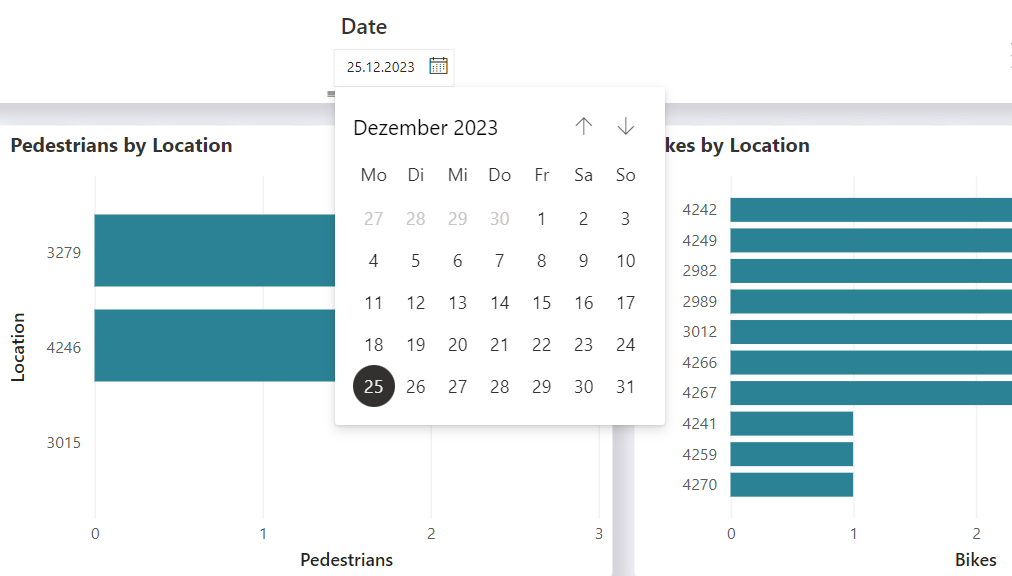
- Create the single date picker slicer
- Add a slicer to your Report Page and drag your date field onto the slicer
- Under Slicer Settings in Visual change the style to “Before” in the options
- Disable the Slicer Header and Slider
- Make the slicer look good again
- Cover up the greyed out “after” part of the slicer using a shape with the same background color
- Add and center the slicer title using a text box or another shape
- Make sure that the slicer and both shapes are set to “Maintain layer order” under Properties –> Advanced Options in General. Otherwise there will be an issue where the user sees the “after” part of the slicer when clicking on the slicer

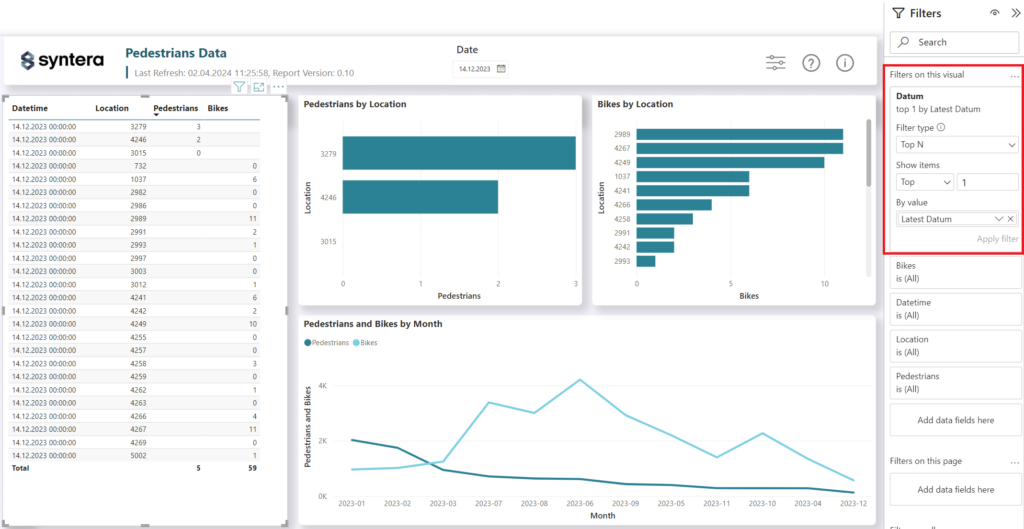
- Add Top N filter to each visual
- Select the visual
- On the Filters pannel under filters on this visual add the date field of your date table
- Under Filter type select Top N and insert 1 for the amount of items to show.
- Add the date field of your date table to By value and change it to “Latest” instead of “Earliest”
- Apply the filter and repeat for each visual in your report
Limitations
One big limitation we encountered so far is that Power BI currently only allows one Top N filter per visual. Since we need that filter for the single date picker to work, we can’t add any more Top N filters to our charts or graphs. There is a workaround that involves creating a rank measure for that specific visual (I’ll go into more detail about this in my next blog). However, for reports that heavily depend on Top N filters, you might be better off considering the solution by Guy in a Cube, since you will need to create a measure per Top N scenario anyways.
There is also another issue in case your date table is missing some dates. If that missing date is selected the slicer shows the user the selected date but the data shown is form the last date that does exist. To avoid this problem, make sure your date table is complete, with no missing dates, if you’re planning to use this method.