Google Analytics 4 data is essential for understanding website performance and user behavior. The native dashboard is great for initial analysis but there are other use cases where it is just not quite enough. What if you want to export the data to combine it with other sources? Or give new users the required permissions all at once? What if you just want to consolidate all your dashboards in a single place? For us, this place is called Microsoft Fabric and in this blog post we’ll explore how to use Fabric Notebooks to connect directly to Google Analytics with the goal of exporting and storing the data in OneLake.
Preparing Google Analytics
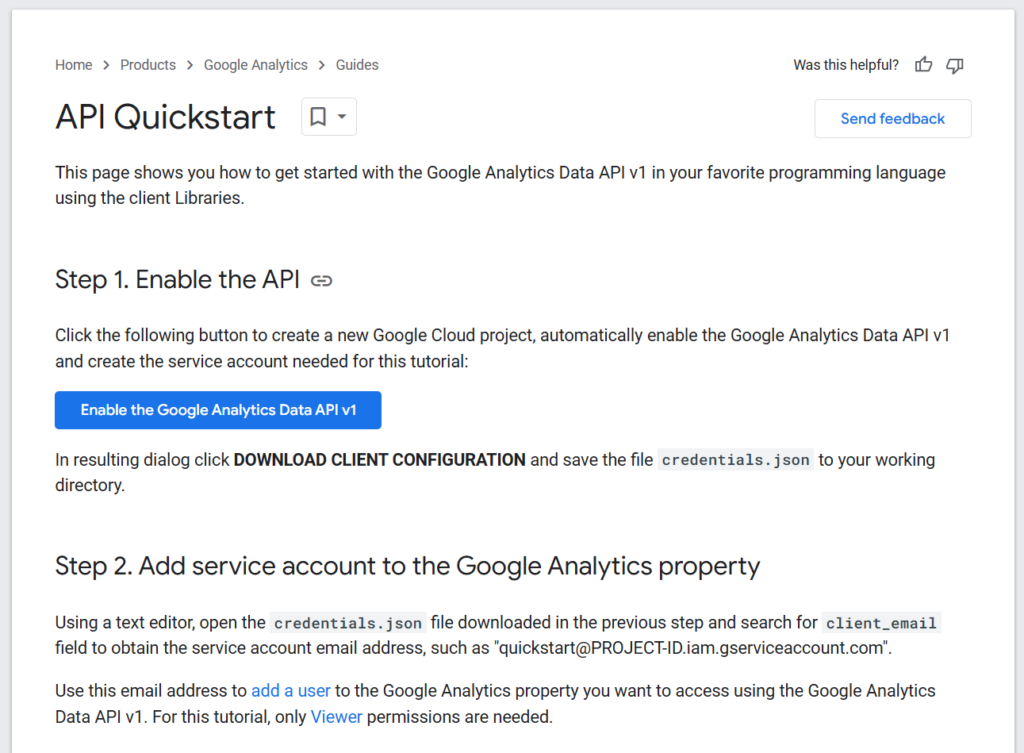
Navigate to Google Analytics (GA) API Quickstart and follow the steps to enable the API access. Step 1 will create a service account, which can be added to your Google Analytics property in Step 2.
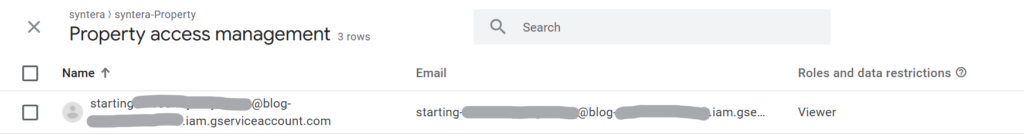
To add the newly created service account to your GA property, follow the “add users” section of this guide. In short, navigate to google analytics and click on the large gear icon in the bottom left. Select “Property access management” and in the upper right corner click on the large “+” sign to add a new permission. Grab the Email-address from the client configuration you downloaded in step 1. and add this user with “Viewer” permissions. The end result should look something like this:
Preparing Fabric Notebook
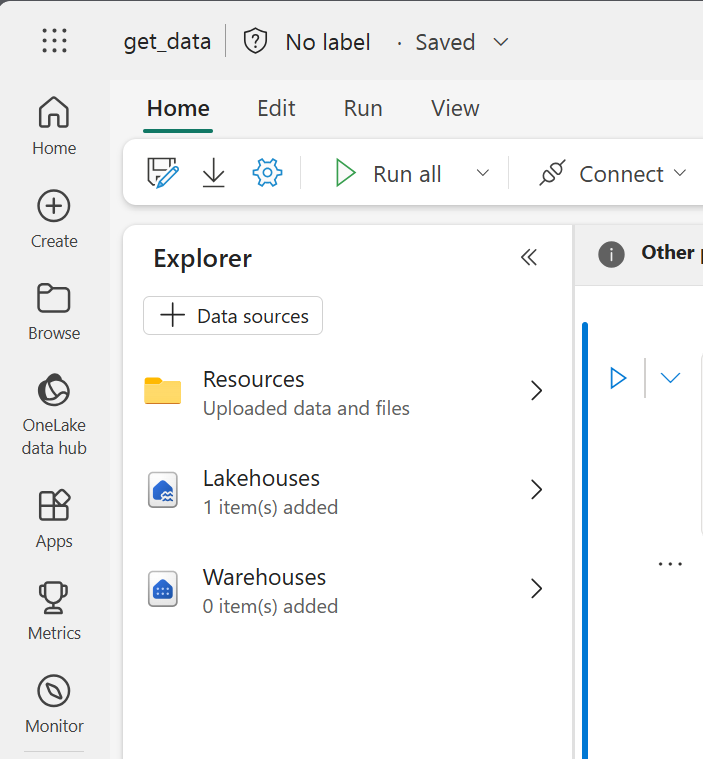
On the Fabric side, we’ll use a Notebook to connect to Google Analytics via the API. To do this, store the credentials file directly in the Notebook’s built-in resources. Open a new Notebook and, in the “Explorer” section on the left, navigate to “Resources.” Under “Built-in,” click the three dots and select “Upload Files.” Upload the client credentials JSON file.
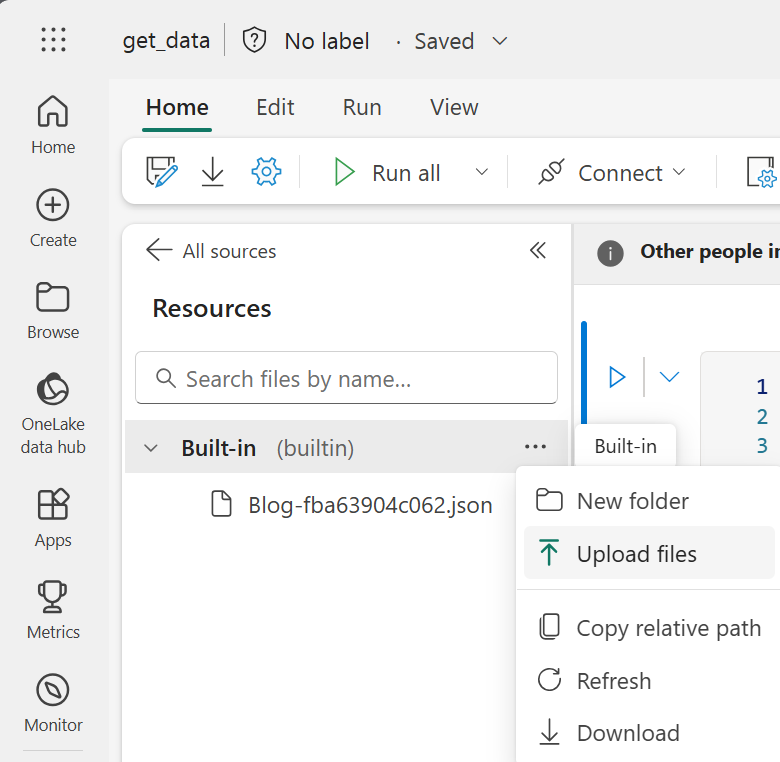
Warning: Storing the credentials directly in the built-in resources can be a security risk. To store credentials securely, take a look at this post on using Key Vault with Fabric Notebooks.
The Code
(Full code at the end of page)
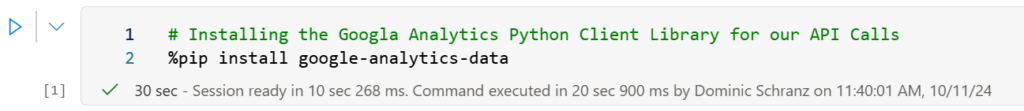
First we need to install the Python client library. Fabric Notebooks provide the possibility to use inline installation to directly get additional packages via PIP. The PySpark kernel will be restarting after the installation and it is therefore required to run in the first cell.
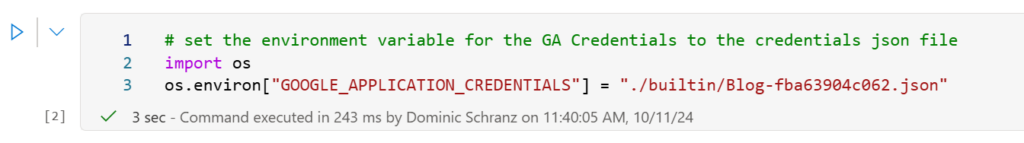
To ensure the successful authentication with the GA API, the environment variable for the credentials needs to be set. This corresponds to step 3 in the API Quickstart. The simplest way to do this in a Notebook is via os.environ. Setting the path to the uploaded credentials json in the builtin resources.
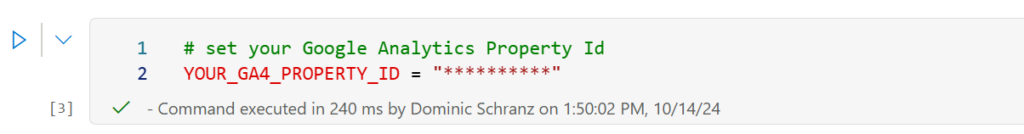
Additionally, the GA property id needs to be set to instruct the client which property will be queried.
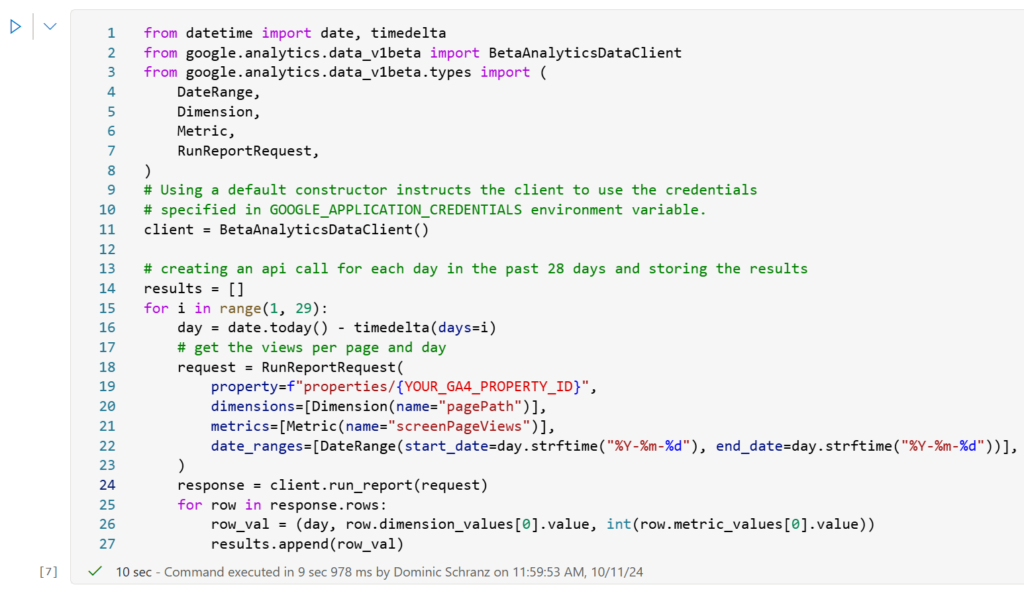
After setting up the application credentials and property ID, the Notebook is ready to call the API and extract data. In the example below, we retrieve views per page and day. While getting page views is relatively straightforward, other queries can get quite complex. Visit the API Dimensions & Metrics Documentation to get a full overview.
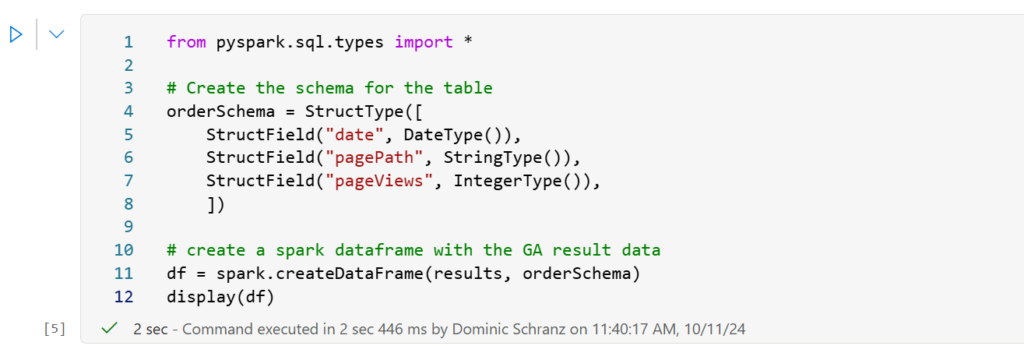
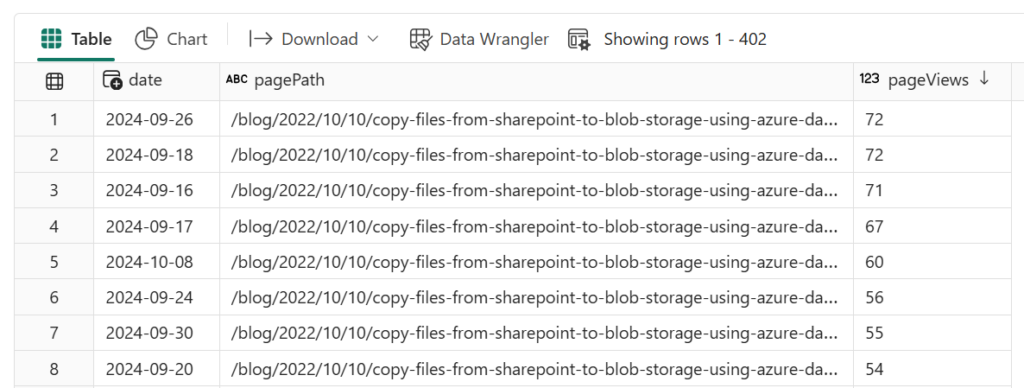
The results of the API calls are stored in a Python list called “results,” which can then be added to a DataFrame for easy storage in a Fabric Lakehouse or Warehouse. The schema defines the data types and column names, which are applied in the spark.createDataFrame() call. Running display(df) shows the extracted data inline, giving you a first look at the results.
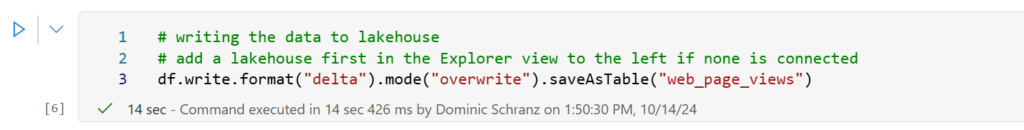
The code below stores this data in a Fabric Lakehouse Table. Ensure that you are not overwriting an existing Table and keep in mind that the write mode “overwrite” makes sense for this initial setup. To add data incrementally each day you would use mode “append” with a different date range and/or upsert logic.
Results
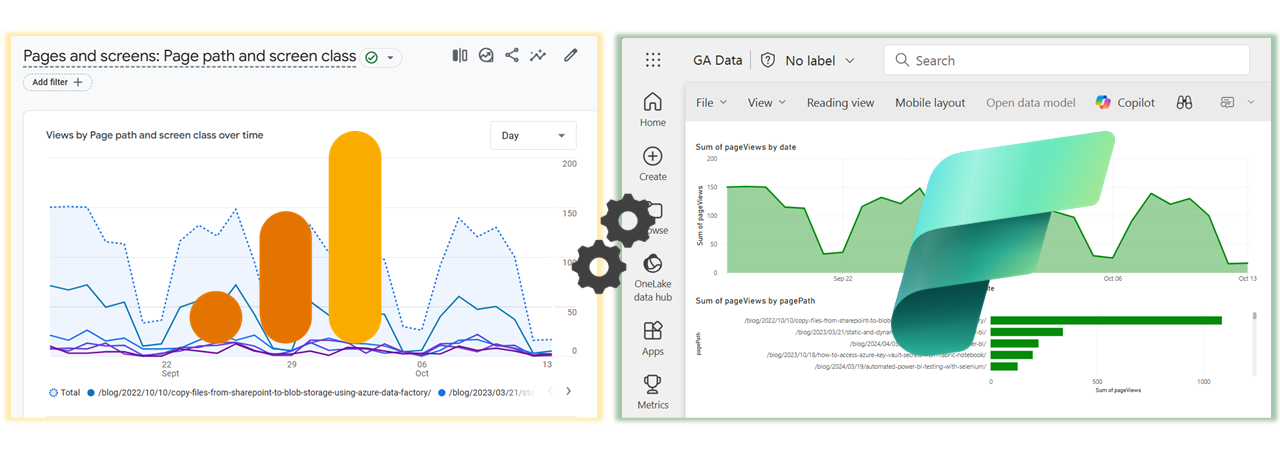
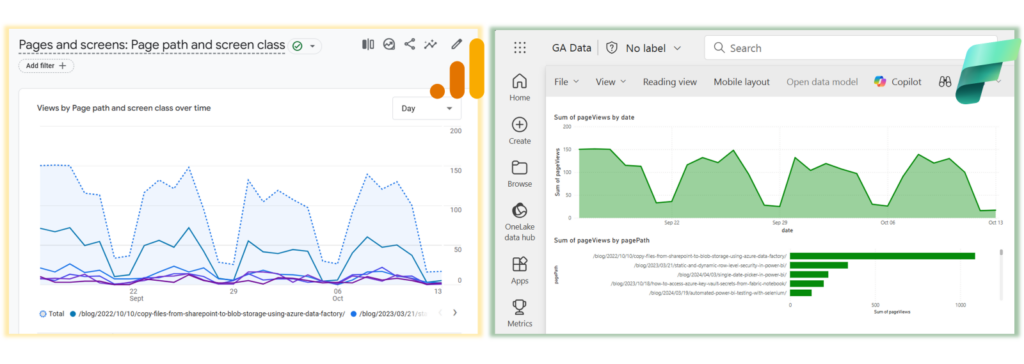
Now that the website performance data is in Fabric, you can transform, combine, and visualize it however you like. Below is a comparison of the original Google Analytics dashboard (left) with the exported data in a Power BI report (right).
Extracting data, while not the most thrilling task, forms the basis for many valuable insights. The method shown in this blog is the foundation for a range of use cases – from centralizing data in a single dashboard to building advanced models, like using AI to analyze similarities in your best-performing pages.
COPY & Paste
# Installing the Google Analytics Python Client Library for our API Calls
%pip install google-analytics-data

# set the environment variable for the GA Credentials to the credentials json file
import os
os.environ["GOOGLE_APPLICATION_CREDENTIALS"] = "./builtin/your_credentials_file.json"

# set your Google Analytics Property Id
YOUR_GA4_PROPERTY_ID = "**********"

from datetime import date, timedelta
from google.analytics.data_v1beta import BetaAnalyticsDataClient
from google.analytics.data_v1beta.types import (
    DateRange,
    Dimension,
    Metric,
    RunReportRequest,
)

# Using a default constructor instructs the client to use the credentials# specified in GOOGLE_APPLICATION_CREDENTIALS environment variable.client = BetaAnalyticsDataClient()

# creating an api call for each day in the past 28 days
# and storing the results
results = []

for i in range(1, 29):
    day = date.today() - timedelta(days=i)
    # get the views per page and day
    request = RunReportRequest(
        property=f"properties/{YOUR_GA4_PROPERTY_ID}",
        dimensions=[Dimension(name="pagePath")],
        metrics=[Metric(name="screenPageViews")],
        date_ranges=[
            DateRange(
                start_date=day.strftime("%Y-%m-%d"), end_date=day.strftime("%Y-%m-%d")
            )
        ],
    )
    response = client.run_report(request)
    for row in response.rows:
        row_val = (day, row.dimension_values[0].value, int(row.metric_values[0].value))
        results.append(row_val)

from pyspark.sql.types import *

# Create the schema for the table
orderSchema = StructType([
    StructField("date", DateType()),
    StructField("pagePath", StringType()),
    StructField("pageViews", IntegerType()),
    ])

# create a spark dataframe with the GA result data
df = spark.createDataFrame(results, orderSchema)
display(df)

# writing the data to lakehouse
# add a lakehouse first in the Explorer view to the left if none is connected
df.write.format("delta").mode("overwrite").saveAsTable("web_page_views")